Deformation and Dislocations
Perfectly periodic lattices are interesting, but in practical applications it is often desirable to study imperfect lattices. To compare to such pratical applications, latticegens lattice generation functions support general deformations via the shift= keyword argument.
This allows for two main classes of deformations: topologically trivial, deformations via a continuous deformation field and edge dislocations, where a discontinuous deformation field corresponds to a missing row of unit cells, yielding a topological point defect.
[1]:
import numpy as np
import matplotlib as mpl
import matplotlib.pyplot as plt

import latticegen
from latticegen.singularities import singularity_shift
Matplotlib is building the font cache; this may take a moment.
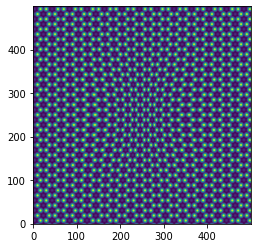
Continuous deformation field
First, let’s look at an example of a simple continuous deformation, in the variable shift. It should consist of two stacked arrays, each the same size/shape as the intended final lattice, (500x500) by default.
[2]:
S = 250
r_k = 0.05
xp, yp = np.mgrid[-S:S, -S:S]
xshift = 0.5*xp*np.exp(-0.5 * ((xp/(2*S/8))**2 + 1.2*(yp/(2*S/6))**2))
shift = np.stack([xshift, np.zeros_like(xshift)])
a = 30
plt.quiver(xp[::a,::a], yp[::a,::a],
          *-shift[:,::a,::a],  # There is a minus sign still wrong.
           units='xy', scale=1, angles='xy')
plt.gca().set_aspect('equal')

[3]:
lattice = latticegen.hexlattice_gen(r_k=r_k, theta=0,
                                    order=2, shift=shift)
plt.imshow(lattice.T, origin='lower')
[3]:
<matplotlib.image.AxesImage at 0x7f57ea8c1670>
Edge Dislocations
In a two-dimensional lattice, the edge dislocation is the only fundamental dislocation. latticegen supports rendering such dislocations using singularity_shift() to generate a corresponding deformation array (discontinuous now).
[4]:
l1 = np.array([90,90])
shift = singularity_shift(r_k, 5)
singularity = latticegen.hexlattice_gen(r_k, 5, 3, shift=shift)
shift2 = singularity_shift(r_k, 5, position=l1, alpha=np.pi)
singularity2 = latticegen.hexlattice_gen(r_k, 5, 3, shift=shift2)
ssum = latticegen.hexlattice_gen(r_k, 5, 3, shift=shift2+shift)
fig, ax = plt.subplots(figsize=[12,12], ncols=2, nrows=2)
ax=ax.flat
ax[0].imshow(singularity.compute().T)
ax[0].set_title('Singularity 1')
ax[1].imshow(singularity2.compute().T)
ax[1].set_title('Singularity 2')
ax[2].imshow(ssum.compute().T)
ax[2].set_title('Both singularities')
ax[3].set_title('Difference')
ax[3].imshow(ssum.compute().T - latticegen.hexlattice_gen(r_k, 5, 3).T.compute(),
             cmap='seismic')
[4]:
<matplotlib.image.AxesImage at 0x7f57e3fc4e50>

Edge dislocation in a moiré lattice
As D.C. Cosma et al. describe, an atomic edge dislocation in a moiré lattice is magnified to a corresponding edge dislocation in the moiré lattice.
With this information a more complex example of the use of latticegen is shown below.
To illustrate the effect of the moiré lattice on the dislocation, we recreate an adapted version of the relevant panels from Figure 3 of De Jong et al.
[5]:
S = 600  #Size of visualization in pixels.
r_k = 0.05
xi0 = 0
alphai=3
sshift = singularity_shift(r_k, xi0, S, alpha=2*np.pi*alphai/6)
lattice1 = 0.7 * latticegen.hexlattice_gen(r_k, xi0, 3, S,
                                           shift=sshift, chunks=400).compute()
lattice1 -= lattice1.min()

theta = 10
l2_shift = np.array([-1.5, -2])
lattice2 = latticegen.hexlattice_gen(r_k, xi0+theta, 3, S,
                                     shift=l2_shift, chunks=400).compute()
lattice2 -= lattice2.min()
moire = np.sqrt((lattice1)**2 + (lattice2)**2)

z = 4
r = slice((z-1)*S//z//2, (z+1)*S//z//2)
[6]:
fig, axs = plt.subplots(ncols=3, figsize=[12, 5], constrained_layout=True)

inset_extent = [r.start, r.stop, r.start, r.stop]

axs[0].imshow(lattice1[r,r].T,
              origin='lower',
              extent=inset_extent,
                  )
axs[1].imshow(moire.T,
               origin='lower',
          )
axs[2].imshow(lattice2[r,r].T,
                 origin='lower',
                 extent=inset_extent,
      )

axs[0].set_title('Bottom layer:\n single dislocation')
axs[1].set_title('Stacked graphene layers')
axs[2].set_title(f'Top layer: rotated by θ$ = ${theta}°')

rect = mpl.patches.Rectangle((r.start,r.start),
                             (r.stop-r.start), (r.stop-r.start),
                             edgecolor='red',
                             facecolor='none')
axs[1].add_patch(rect)

for ax in [axs[0], axs[2]]:
    for axis in ['top','bottom','left','right']:
        ax.spines[axis].set_color("red")
