Quasi-crystals
Generalizing beyond the obvious symmetries
When using anylattice_gen(), we can choose any rotational symmetry. This generalizes beyond just 2-fold, 4-fold and 3/6-fold symmetry. So let’s see what happens if we use 5, or 7, rotational symmetries were no periodic lattice / covering of the plane exists… Some pretty wild patterns might appear!
[1]:
import numpy as np
import matplotlib.pyplot as plt

import dask.array as da

from latticegen import anylattice_gen, generate_ks, combine_ks
from latticegen.transformations import *
[2]:
data = anylattice_gen(0.05, 0, order=2, symmetry=5).compute()
plt.imshow(data.T,
               vmax=np.quantile(data,0.99),
               vmin=np.quantile(data,0.01),
              )
plt.title('symmetry = 5');

This pattern looks like it repeats, but it never actually precisely does… We can do this for all kind of different symmetries of course:
[3]:
fig, ax = plt.subplots(ncols=2, nrows=3, figsize=[12,18])
for i,sym in enumerate([3,5,7,8,9,11]):
    data = anylattice_gen(0.1, 0, order=2, symmetry=sym).compute()
    ax.flat[i].imshow(data.T)
    ax.flat[i].set_title(f'symmetry = {sym}')
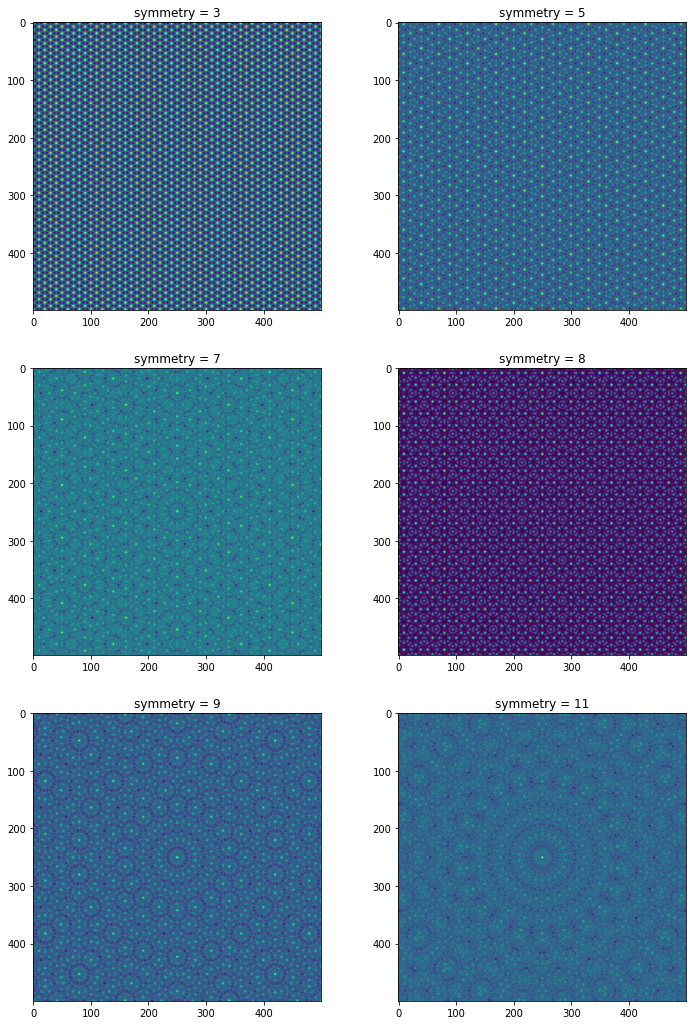
The 8-fold and 9-fold symmetric patterns are actually closely related to moiré patterns of square and 6-fold symmetric lattices…
Effect of the order parameter
Now we can of course also explore what influence the order parameter has on the patterns. (This is due how the basis vectors are combined. Checkout combine_ks() to see how.)
[4]:
fig, ax = plt.subplots(ncols=2, nrows=4, figsize=[12,24])
ax = ax.T
for i in np.arange(1,5):
    data = anylattice_gen(0.1, 0, i, symmetry=5).compute()
    mean = data.mean()
    dv = max(data.max()-np.quantile(data,0.99), data.mean()-np.quantile(data,0.01))
    im = ax[0, i-1].imshow(data.T, cmap='seismic',
                   vmax=mean+dv, vmin=mean-dv,
                  )
    ax[0, 0].set_title('symmetry = 5')
    ax[0, i-1].set_ylabel(f'order = {i}')
    data = anylattice_gen(0.1, 0, i, symmetry=7).compute()
    im = ax[1, i-1].imshow(data.T, cmap='seismic',
               vmax=mean+dv, vmin=mean-dv,
              )
    ax[1,0].set_title('symmetry = 7')
